
The August 2025 Monthly Economic Report for EVE Online has arrived.
EVE Online nerds harder
As always, others write and comment about the MER, so if you want different views or the raw data, you can start with this list.
CCP highlights
CCP is planning updates to the MER. Hopefully they will leave the killdump.csv alone. They have already changed it up once in the last five years, which broke my simple PowerBI dashboards. Anyway, this is what they had to say:
- The Future & Beta:
- We are doing major work on both the data-pipeline and output (plots and CSVs) of the MER. You can see some of the early output in the beta directory. Expect to see significantly more in the September MER.
- Some plots will removed, mostly due to data issues.. We’ll go though each in detail next MER release.
- Specific to the Import/Export Chart – The data-source for this being depreciated. Regardless, we’ll continue to run it for as long as we can, in its current state. We understand there is some interest in it at the moment.
- Some of the issues it has:
- It ignores Titan Bridge movements.
- It ignored Jump Bridge movements (rare between regions) until recently.
- We wanted to only include Non-Singleton items (that is, un-assembled items), in cargo holds. We can’t, the current data-source doesn’t differentiate between singletons and non-singletons. Nor does it differentiate between different holds (for example – ship holds for Capitals). We want the chart to show the movement of goods (but not ships) between regions. Instead we get a weird mix of goods and some ships in some cases.
So that is ABOUT the MER, but not about what the MER is showing. So, we can go to a couple of likely topics that CCP might have commented on… like the price of PLEX.
The price of PLEX continues to come down. I was skeptical that CCP’s change to a unified PLEX market would change the price, but we’ve gone from PLEX touching 6.2 million ISK per at its peak to it touching 5.2 million ISK per just this past weekend.
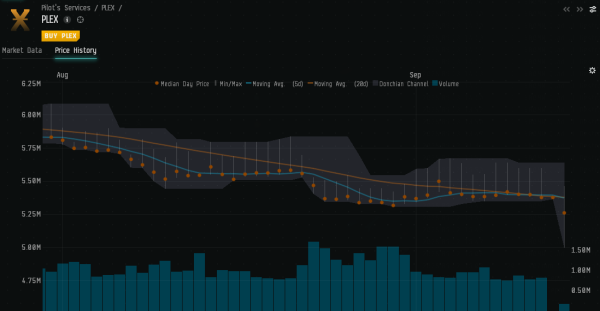
The PLEX market price from August to mid-September
And while there is correlation, I am not sure I can fully credit causation yet. To start with, people are already complaining on Reddit about CCP continuing to have PLEX sales but not being nearly as aggressive as they have been with Omega sales in the in-game store. Those sales were doing a lot to drive up the price of PLEX, and PLEX sales in the web store and a curtailment of in-game Omega sales seem like a scenario that would move the price down.
I even said as much in the past, that CCP’s sale behavior was driving the rise in PLEX price as much as anything. But cheaper in-game PLEX is as good as having a sale, right? It probably doesn’t feel as good.
On top of that, the economy continued to cool in August, with the velocity of ISK continuing to trend down.
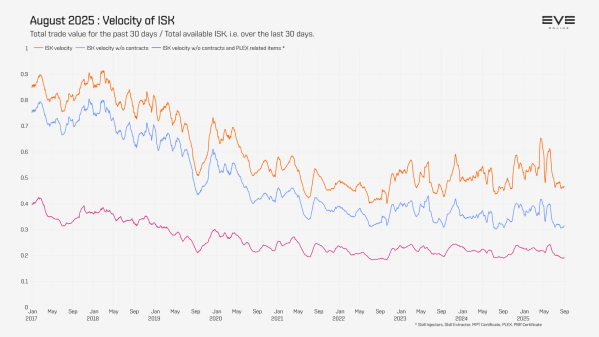
August 2025 – Velocity of ISK
It is significant that the market with PLEX was volatile, but even the market without contracts of PLEX items was seeing a decline. Likewise, the money supply remained in decline.
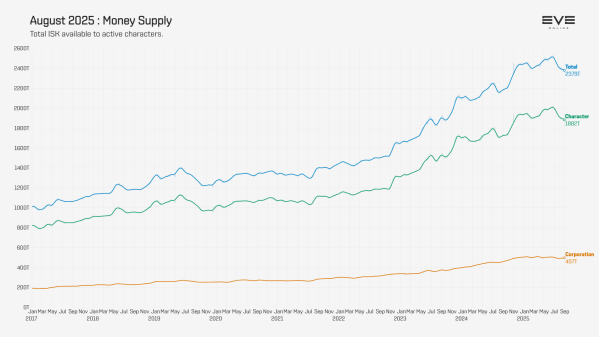
August 2025 – Money Supply
Less money in play, less money chasing PLEX… or anything else. So we had another decent drop in the mineral price index.
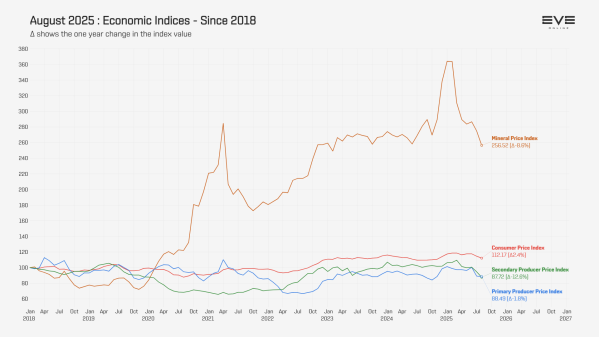
August 2025 – Economic Indices since 2018
However, even that is likely supply and demand in play as production also saw a big decline.
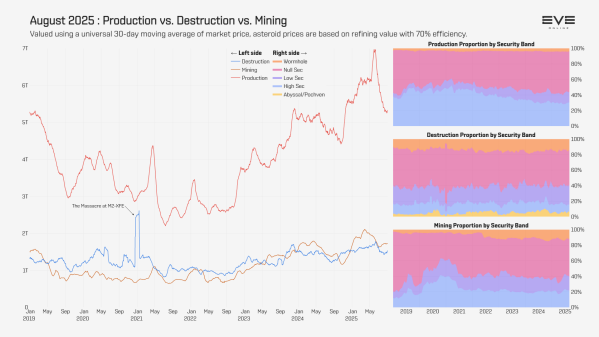
August 2025 – Produced, Mined, Destroyed
If producers aren’t buying, but mining doesn’t fall at the same rate, there will be downward pressure on the price of minerals. So it goes.
Destruction
On the destruction front, total losses were up and from the summer nadir of July. August losses per day were still the second lowest of the year, but at least they were trending up. Overall ISK lost was also up, but not at the same rate as ship losses.
- Loss Count Total
- January – 514,511 total losses
- February – 427,027 total losses
- March – 538,625 total losses
- April – 464,177 total losses
- May – 530,632 total losses
- June – 476,877 total losses
- July – 427,662 total losses
- August – 442,795 total losses
- Avg Losses per Day
- January – 16,597.13 losses per day
- February – 15,250.96 losses per day
- March – 17,375.00 losses per day
- April – 15,472.57 losses per day
- May – 17,117.16 losses per day
- June – 15,895.90 losses per day
- July – 13,795.55 losses per day
- August – 14,283.71 losses per day
- Total ISK Value Lost
- January – 46.86 trillion ISK
- February – 44.55 trillion ISK
- March – 50.78 trillion ISK
- April – 47.77 trillion ISK
- May – 52.10 trillion ISK
- June – 51.39 trillion ISK
- July – 45.80 trillion ISK
- August – 46.39 trillion ISK
- Total ISK Value Lost per Day
- January – 1,511.77 billion ISK per day
- February – 1,590.99 billion ISK per day
- March – 1,638.07 billion ISK per day
- April – 1,592.22 billion ISK per day
- May – 1,680.63 billion ISK per day
- June – 1,713.09 billion ISK per day
- July – 1,477.51 billion ISK per day
- August – 1,496.51 billion ISK per day
And where did things blow up?
First the view by region.
| Region | Sum of ISK Lost | % of Aug | Region | Count | % of Aug |
| Pochven | 2.52 trillion | 5.43% | Etherium Reach | 25,899 | 5.85% |
| Metropolis | 2.44 trillion | 5.27% | Metropolis | 23,274 | 5.26% |
| Delve | 2.16 trillion | 4.67% | Black Rise | 23,265 | 5.25% |
| The Forge | 1.88 trillion | 4.05% | Heimatar | 19,782 | 4.47% |
| Etherium Reach | 1.66 trillion | 3.58% | Delve | 17,338 | 3.92% |
| Vale of the Silent | 1.56 trillion | 3.36% | Insmother | 17,221 | 3.89% |
| Insmother | 1.47 trillion | 3.16% | The Forge | 16,099 | 3.64% |
| Sinq Laison | 1.44 trillion | 3.10% | The Citadel | 14,364 | 3.24% |
| Heimatar | 1.35 trillion | 2.91% | Placid | 14,321 | 3.23% |
| Providence | 1.34 trillion | 2.89% | Pochven | 13,557 | 3.06% |
As with last month, Pochven tops the charts. Related to that, the corporation that managed the highest level of ISK destruction, ISEEU Corporation, which blew up just over 1 trillion ISK (nearly double what Lazerhawks, the next player corp on the list, blew up in WH space) pretty much exclusively in Pochven if you look at their kill board. And they often blow up expensive stuff there.
When we drill down to systems, these were the top ten for ISK lost and destruction count.
| System | Region | Sum of ISK Lost | % of Aug | System | Region | Count | % of Aug |
| J121006 | D-R00021 | 967.10 billion | 2.08% | G-QTSD | Etherium Reach | 10,132 | 2.29% |
| Jita | The Forge | 836.21 billion | 1.80% | J121006 | D-R00021 | 8,558 | 1.93% |
| Ahbazon | Genesis | 789.67 billion | 1.70% | Ahbazon | Genesis | 8,279 | 1.87% |
| Y-MPWL | Providence | 618.10 billion | 1.33% | Jita | The Forge | 7,744 | 1.75% |
| G-QTSD | Etherium Reach | 598.76 billion | 1.29% | Tama | The Citadel | 7,093 | 1.60% |
| Old Man Star | Essence | 587.94 billion | 1.27% | Amamake | Heimatar | 5,757 | 1.30% |
| Arnher | Metropolis | 527.76 billion | 1.14% | Y-MPWL | Providence | 5,661 | 1.28% |
| 39P-1J | Delve | 381.43 billion | 0.82% | Auga | Heimatar | 5,466 | 1.23% |
| Evati | Metropolis | 371.43 billion | 0.80% | Nennamaila | Black Rise | 4,081 | 0.92% |
| Amamake | Heimatar | 313.29 billion | 0.68% | C-J6MT | Insmother | 4,044 | 0.91% |
Looking at the losses per day over the month, we get mostly the usual clustering of spikes in destruction on the weekends. I did sort out destruction by system into individual dates and marked the top five on the chart to correlate with their respective spike.
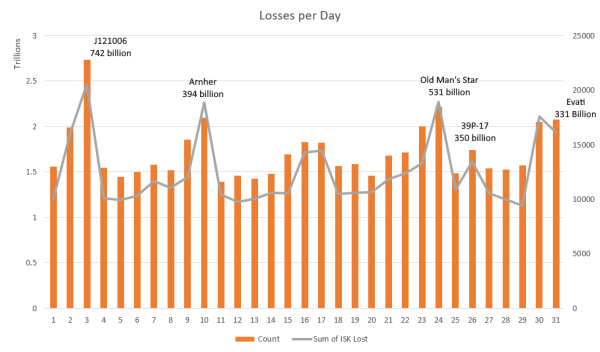
August 2024 – Losses per Day
Those five systems each saw battles. Unfortunately, CCP’s data only lets me filter down by date and their map doesn’t show WH space, so whatever happened at J121006 would have been missed on that in any case.
| Day | System | Region | Sum of ISK Lost |
| 3-Aug | J121006 | D-R00021 | 742 billion |
| 24-Aug | Old Man Star | Essence | 531 billion |
| 10-Aug | Arnher | Metropolis | 394 billion |
| 26-Aug | 39P-1J | Delve | 351 billion |
| 31-Aug | Evati | Metropolis | 330 billion |
Finally, I wanted to run the safety index chart again. This is a simple measurement of earnings in a region (bounties + mining output) divided by the destruction listed.
| Rank | Region | Sec Band | Safety Index |
| 1 | Outer Ring | NPC Null | 12.25 |
| 2 | Tenal | Null | 11.99 |
| 3 | Oasa | Null | 11.52 |
| 4 | Branch | Null | 11.11 |
| 5 | Verge Vendor | High/Low | 10.43 |
| 6 | Impass | Null | 9.41 |
| 7 | Feythabolis | Null | 9.39 |
| 8 | Wicked Creek | Null | 8.38 |
| 9 | Period Basis | Null | 8.03 |
| 10 | Immensea | Null | 7.87 |
| 11 | Cobalt Edge | Null | 7.75 |
| 12 | Fountain | Null | 7.63 |
| 13 | Esoteria | Null | 7.61 |
| 14 | Kador | High/Low | 7.21 |
| 15 | Malpais | Null | 7.16 |
| 16 | Detorid | Null | 7.13 |
| 17 | Deklein | Null | 6.55 |
| 18 | The Spire | Null | 6.46 |
| 19 | Vale of the Silent | Null | 5.72 |
| 20 | Molden Heath | High/Low | 5.55 |
This month Outer Ring, and NPC null sec region topped the list, with 230 billion IS in earnings over 18.6 billion ISK in losses. As with last month, the low numbers lined up to boost a fairly quiet region for both destruction and earnings to the top.
Compare that to the next two regions, Tenal and Oasa, which saw 148 and 150 billion ISK in destruction respectively. Earnings for Tenal were 1.78 trillion ISK while Oasa saw 1.74 trillion in earnings.
The highest scoring non-null sec region, Verge Vendor, had 41 billion in losses for 440 billion in revenue, while Kador, which was in first place for July, had 160 billion in losses for 1.61 trillion ISK in earnings. The lion’s share of earnings in both regions was mining.
Again, I wouldn’t read too much into this. Other revenue streams, like mission rewards, planetary industry, and market sales can’t really be factored into this, and high/low sec doesn’t really produce bounties the way null sec ratting does. I am just interested to see trends, to see which regions make it onto the list each month for now.